
 Бизнес игры
  Juegos de negocios
  Geschäftsspiele
  Jogos de negócios
  Giochi aziendali
  Jeux d'entreprise
  Trò chơi kinh doanh
  ألعاب الأعمال
  Επιχειρηματικά παιχνίδια
  Forretningsspil
  משחקי עסקים
  商业游戏
商业游戏  비즈니스 게임
  Permainan perniagaan
  Zakelijke spellen
  Forretningsspill
  Gry biznesowe
  Jocuri de afaceri
  İş oyunları
  Liiketoimintapelit
  Obchodní hry
  Affärsspel
  ビジネスゲーム


- Retail Market
- Market development index
- Sample report analysis
- Market analysis: specific indicators
- Sample report analysis
- Competitions assessment
- Competition analysis: products, sales, enterprises
- Competition assessment
- Market structure and sales volumes
- Navigating the market
- Service sector market
- Navigating the market
- Production sector analysis
- Reading graphic reports
- Key manufactures
- Reference
Retail Market
For market analysis click on «Analytics» > «Market Analysis». The information on market situations is categorized based on the following sectors:

Retail market reports are one of the most important in the business simulation. It includes information about the consumer market: product price and quality, market maturity and capacity, key players, etc. The information can be filtered based on specific geographic locations that will help assess the selling potential of your product.
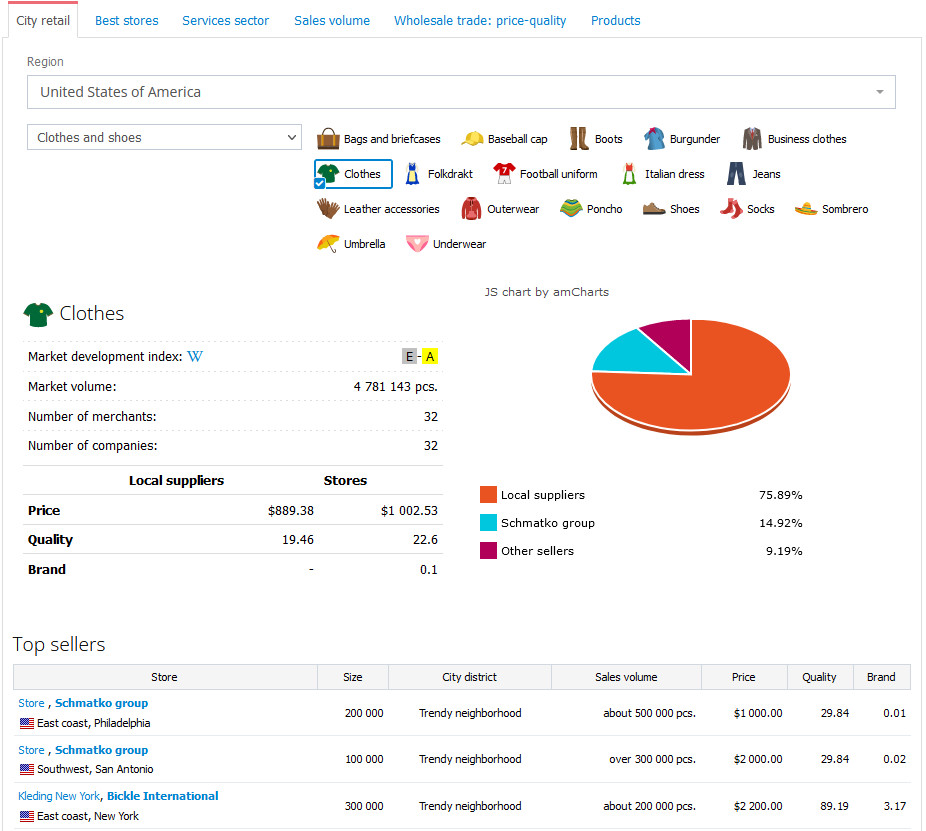
A sample of Clothes market report in the USA:
Market development index
For a quick assessment of market potential, a market development index can be used. It can be found in «Market analysis» / «City Retail»:
The index rating:
AAA — oversaturated market, supply exceeds the demand by more than three times.
AA — oversaturated market, supply exceeds the demand by more than two times.
A — oversaturated market.
B — saturated market.
C — the initial stage of saturation.
D — the market is not saturated.
E — the market is not saturated, the local suppliers’ share is more than 50%.
Sample report analysis
The market development index is «E—A», which means that the market has potential. Two key players make up one-fourth of the market in total (sales volumes for both are 150 000 units and the whole market volume is 600 000 units.).
Local suppliers offer the product with a quality little higher than a unit at a price of about 1400. The market leader offers the product of high quality (about 78) at the price of 700. The products offered by another player are of a quality of about 30 and a price of 230. Both offers are more attractive than the market average (the price is lower, whereas the quality is higher). Use this information as a guide before launching a product.
Market analysis: specific indicators
For detailed market and competition analysis select the city of your interest. You will receive information on key indicators.
A sample of detailed Clothes market report in New York:
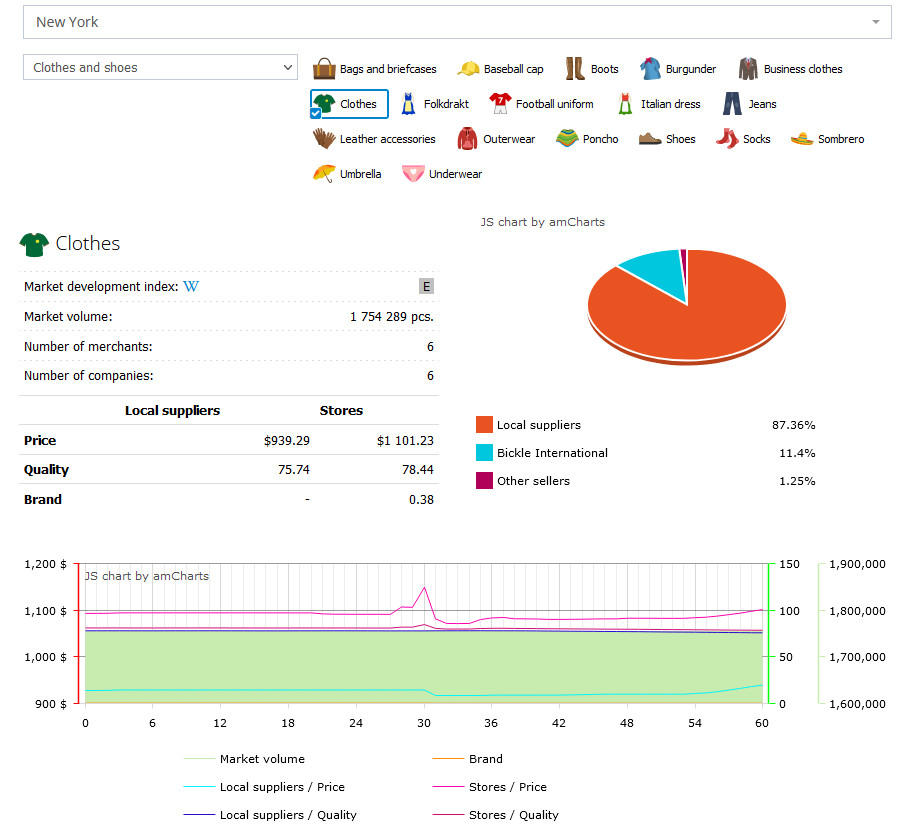
Sample report analysis
Competition in the market simulation is moderate – the development index is ”E”. Approximately 5/6 of the market belongs to local suppliers – computer shops and stores, which offer products on the market since there are no real participants with such offers. Just over 1/6 of the market is controlled by a real participant. The market volume is stable and has not drastically changed. The products’ brand is zero. There is a positive trend in quality and price dynamics in local stores. It is a reaction to the actions of a real participant, who has entered the market with a product of a higher quality and price.
Local suppliers have also begun to raise the prices and quality of their products to remain competitive.
Competitions assessment
You have the opportunity to see the behavior of your competition. Click on the subdivision of your competitor in the competition report (in the example of the report “store») or just a company name, in the second case, you will see the whole list of subdivisions of your competitor.
Competition analysis: products, sales, enterprises
Select the competitor of your choice In the «Market Analysis» tab. You will see the whole list of their enterprises. By clicking on a specific enterprise you will see a detailed report of its activity.
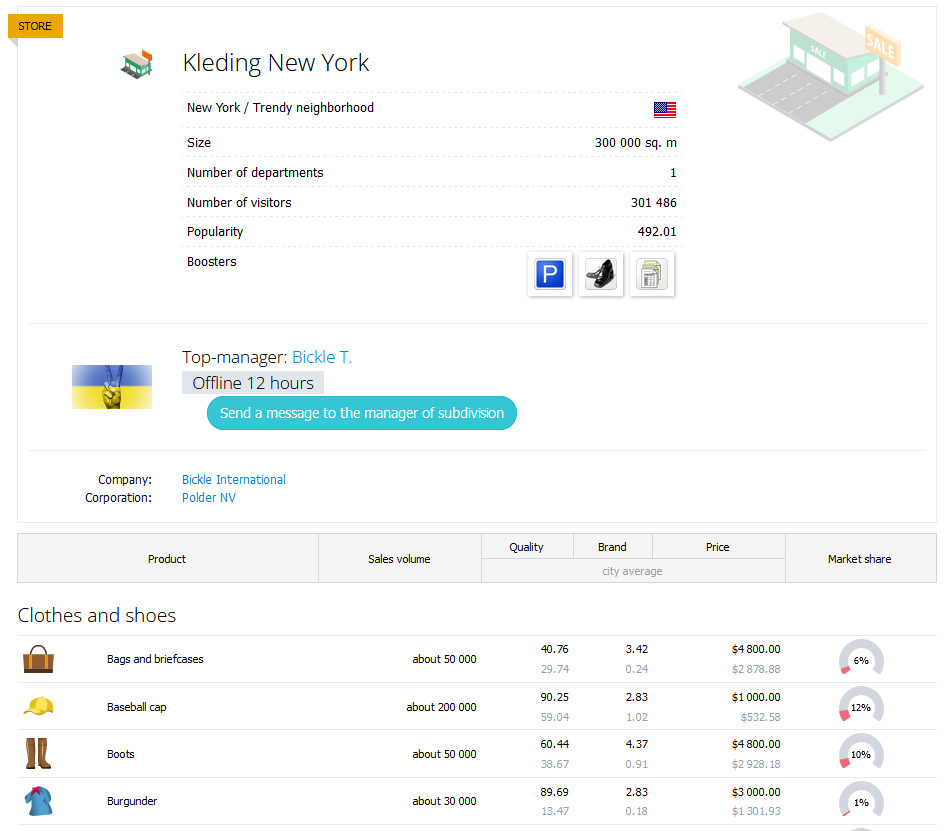
Competition assessment
The store is of the biggest size possible – 300 thousand square meters. It specializes only in selling clothes and shoes (there’s only one department). The store is of an elite service level, which means that the number of employees and their qualifications are of a relevant standard, and the size of the trade hall meets the customer traffic flow.
To increase traffic, you can select the following options:
- Parking. One of the business boosters (available on the store’s homepage).
- Advertising campaign
The store offers a wide range of products. The products that sell the most are the ones with a price higher than the market average, their quality is also significantly higher than the city average.
Market structure and sales volumes
A useful report on market structure and the key players is available in «Analytics» > «Market Analysis» > «Sales volumes». Just click on any competitor to access the information about their company.
Navigating the market
Reports on market structure are based on separate products. Select the product category first then specify the concrete product.
You can also select a specific location (regions and cities. If a concrete location is not selected, the product report is based on all data (market situation of the products in all geographical locations).
Service sector market
A sample of the service sector market report:
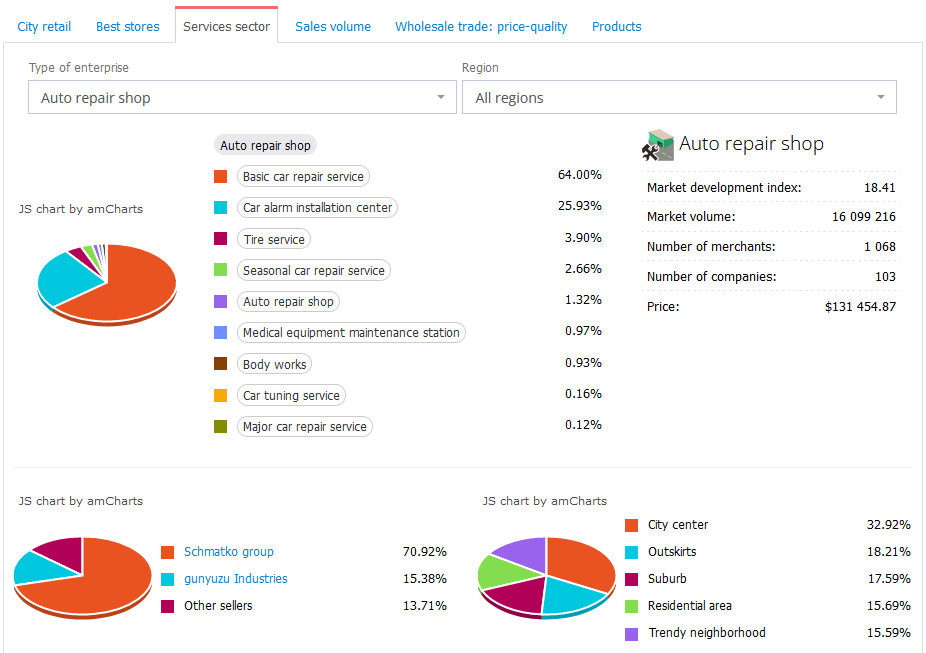
Navigating the market
Service sector market reports are based on specific service sector specializations and geographical locations.
The reports contain information on key players and market structure based on competitors’ specializations and the geographical locations of their enterprises. The report also includes data on market size and average prices.
Below the graph, there is detailed information on your competitors. You will be able to access the company or enterprise report of your competitors.
Production sector analysis
Production reports are available by clicking on «Analytics» > «Market analysis» and selecting the «Production» > «General report» tab. Select a product category and the product.
A sample of the Gasoline 92 production report:
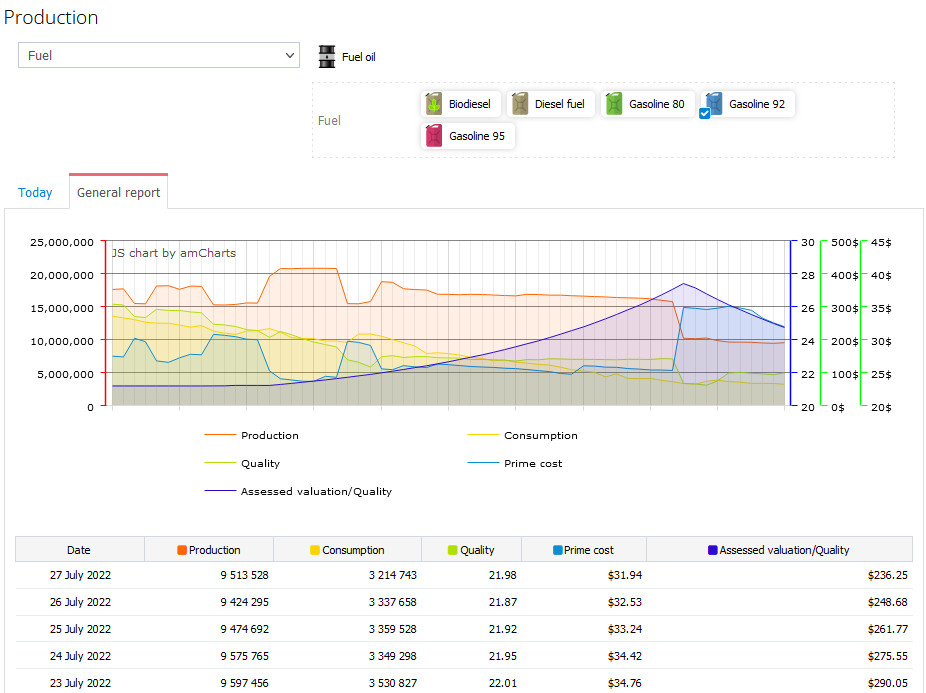
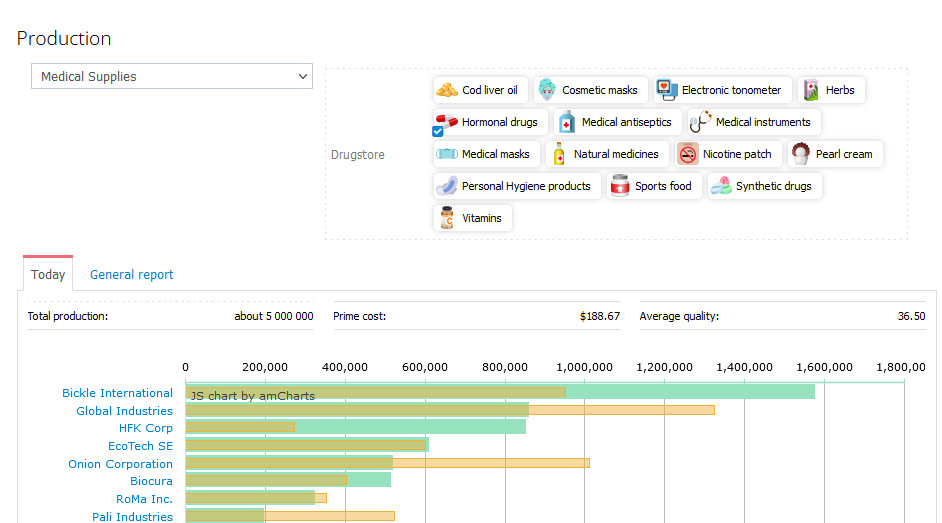
The information on the market structure and key competitors is available in «Production» > «Today»:
Reading graphic reports
Graphic reports show the data on production average quality and costs. These reports are useful for understanding general market trends. From the Gasoline example, we can see the increase in production quality and reduction in prime costs.
It means that someone has introduced new technology. The production volumes for this moment have decreased and at the same time
there is an increase in consumption of the product in the market.
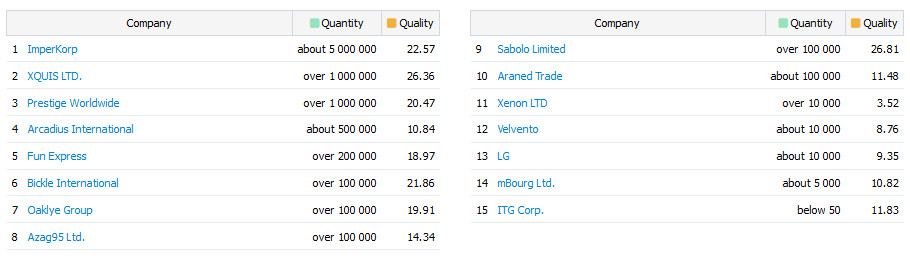
Key manufactures
For a detailed analysis see the information on key competitors («Production» / «Today»).
The key player in Gasoline production is company “ImperCorp”, which is about 5 times bigger than the second biggest competitor. When choosing a production strategy, the information on the competition in the market is highly useful.
Reference
Information on the types of enterprises, products, raw materials and production types, trade, and business boosters is essential in business management in Virtonomics. The information can be found by clicking on «Analytics» > «Reference».
For example, this data will inform you what raw materials are necessary for the production of Cars, the duration of construction of such a factory, and how many product units can be produced in one game turn:
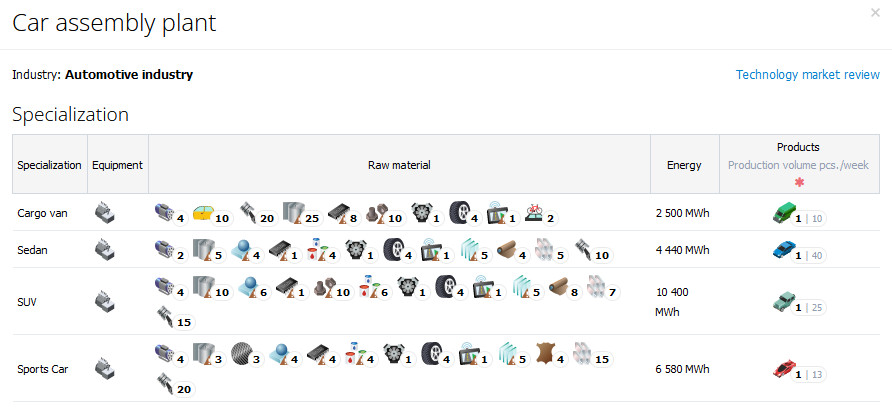
By clicking on the component or raw material, you will see the information on what is needed to produce them. It is vital information for planning to establish a vertically integrated company.
The reference data is based on the following sections:
- Types of enterprises
The list of all types of manufacturing enterprises, their production, required raw materials, and production cycle, the time needed to build a factory.
- Products and raw materials
Products and raw materials are bought and sold by the participants of the business simulation. This section also contains the data on the raw material, from which products are made. By clicking on the raw material of your choice, you will see the same report and the information on where this raw material is used.
- Trade
The products that are offered to the end users in retail. Also, the section contains information on raw materials, which are necessary for manufacturing the products.
- Business boosters
The list of all business boosters in the simulation, their prices, service costs, and validity periods.
Marketing and advertising
The marketing process in the simulation is based on a popular 4Р concept:
| (Product) | The product must be in-demand in the market and have attractive price, quality and brand. Before launching a new product or starting a manufacturing business, conduct a detailed analysis of your competition, the average city price, best price offers, quality and brand. There are competitors in the market, competing with them, so you will have an advantage over them in at least one of these parameters. If the product is new to the market, then you have a lot of room for experimenting. |
| (Price) | Price is one of the most important factors. It is responsible for the overall product perception by the customers together with quality and brand. As like in real life, the prices in the simulation can change with every game turn, since the virtual economy is created by the actions of thousands of users worldwide. Pay attention to price changes and new significant competitors. Experiment with prices. |
| (Place) | Location is a very important factor for certain subdivisions. For example, if you plan to work with VIP customers and offer them high-quality goods of high-end brands, the store should be located in the city center or trendy neighborhood. The qualification of employees and their ability to provide quality service to all visitors are also important. |
| (Promotion) | Advertising helps sell the products. Depending on your targets, the advertising campaign can be focused on promoting the product or subdivision: Advertising the product — massive ad campaigns. They are implemented in the offices (see «Advertising» tab) and is working in the whole region, where the office is located. Such campaigns influence the «Brand» category of your product. Advertising the subdivision —local advertising campaigns. They are set in a specific subdivision of your company (e.g. store) in order to increase the popularity of the product and customer traffic of that particular store. You can find more information on advertising in Virtonomics in chapters «For new users» > «Advertising». Apart from advertising campaigns, we recommend using business boosters, which are able to enhance the promotion of your products and subdivisions. You can choose them on the homepages of subdivisions. |
Marketing reports
There are a lot of marketing reports, which will help you make the right decision.
Geographical locations «Analytics» / «Macroeconomics».
The information included in the report:
- Available countries, regions, cities. Demographic situation, tax fees, average city salary, the changes of the key indicators (after selecting a specific city).
- Transport: logistics expenses from point «А» to point «B», minimal import and export fees.
- Renewable resources: Resource/City.
Market analysis «Analytics» / «Market Analysis».
The information included in the report:
- Market volume, key competitors, competition level for retail, service sector.
- Trends in prices, quality, brand (after selecting a certain location).
Company reports «My company» / «Reports».
Financial reports (sales reports by products and subdivision), marketing reports (product range, brands, promotions, service sector and retail), sales in the context of goods and consumers.